Core Web Vitals - The foundation of a delightful user experience
Februar 10, 2022

The first speaker of the webinar Time to speed up! was Maria Lopez-Latorre, a Mobile Sites Specialist Engineer at Google, and she was speaking about Core Web Vitals, what they are, and how to measure and improve them. We bring you the summary of her speech below.
Performance culture
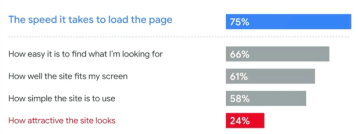
You might think that performance and metrics don’t apply to you. You care about the business, right? But at the end of the day, it is all about the users. We need to understand that performance is an inevitable part of user experience. And an essential one. Why? Let’s take a look at the graph below. What matters the most to users?

What matters to users the most?
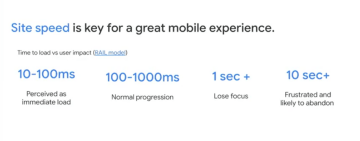
Speed matters the most! Surprised? This all makes better sense when you think about the fact that it takes us about 50ms to form a first impression. We get easily disrupted and disappointed when things don’t work as expected. In its research “Milliseconds make millions”, Deloitte found out that site speed improvement of just 0.1s leads to a significant increase in conversion rates (e.g., by more than 8% in retail) and average order value. This is just another proof that site speed is key for a great mobile experience.

Core Web Vitals
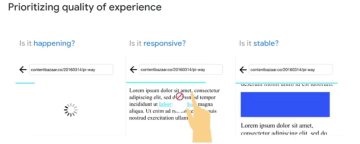
Historically, there have been many metrics to measure performance, but they might not be that reflective of what the user experience could be. The basic principle of Core Web Vitals is to focus on user-centered metrics. So what are those three crucial points that really matter?
- Is something happening on the page? Do you see something straight away?
- Are the interactions smooth? Is something happening when you click on something?
- Is the page stable, or does it shift because of something?

According to these points, three Core Web Vitals were born.
- Largest Contentful Paint
- Measures when the page becomes useful to the user or when the main content on the screen has likely loaded.
- Major factors that affect this metric are server response time, CSS blocking time, and asset/subresource load time.
- As the layout changes, the element recognized as LCP changes as well, depending on the part of the screen that is occupying. You are likely to have different LCPs on different devices.
- First Input Delay
- Measures your user’s first impression of your site’s interactivity and responsiveness.
- This metric can be measured only in the field.
- Cumulative Layout Shift
- Measures layout stability to ensure users experience smooth and natural interactions.
- In other words: how much content moves and how far does it move within the viewpoint.

How do we measure Core Web Vitals?

What are the measuring tools?
For lab data, you can use tool such as WebPage Test . For field data, you may use Google Analytics or Chrome UX report, or you can also use mixed data set such as PageSpeed Insights. It is not that much about what tools you use. It is important that you monitor Core Web Vitals at all. Just don’t forget that many factors have influenced the lab data, such as the browser, location, device, etc. Continuous monitoring is essential to detect performance regressions and react timely.
How can we optimize/improve Core Web Vitals?
Elements that affect LCP
- <img> elements
- <image> elements inside an <svg> element
- <video> elements
- An element with a background image loaded via the URL () function
- Block-level elements containing text nodes or other inline-level text elements
Common causes for a poor LCP are slow server response, render-blocking JavaScript and CSS, slow resource load times, and client side-rendering.
Elements that affect FID/total blocking time value
It’s about JavaScript! The only thing that can keep the browser from responding to a user event is JavaScript on the page keeping the browser busy. Common causes for a poor FID/TBT are long tasks, long JS execution time, large JS bundles, and render-blocking JS. The reason for this is that the browser handles most of the tasks in a single thread.
Elements that affect CLS
CLS is not only measured during initial load. Layout shifts can occur in two phases:
- Loading process – page is loaded, element rendered, can push down other elements during the loading process.
- During page usage – the user interacts with the page, causing new elements to be injected, contents loaded lazily, and causing layout changes.
CLS is reported for a page after a user navigates or closes the page. The longer users stay on a page, and the more layout shifts occur, the higher CLS will become. This is critical for single-page applications where no navigation happens during the whole session. Common causes for a poor CLS value are images without dimensions, ads, embeds, iFrames without dimensions, dynamically injected content, and web fonts causing a change in the layout.
How to optimize CLS?
Here are some useful tips, how you can improve your values.
- Add dimensions to elements (e.g., width/height to images, use CSS to retain aspect ratio)
- Reserve space for dynamic elements (placeholder box for dynamic ads, add initial size for resizing iframes, responsive sizes with media queries)
- Dynamic content (avoid insertion above existing content, otherwise use placeholders or skeleton UI)
- Web Fonts causing FOUT/FOIT (preload fonts to have them at first paint, “font-display: optional” for too slow fonts, you can easily prevent font-rendering layout shift by using tools like Font style matcher)
- Animations (use CSS transform to prevent relayouting)
Don’t forget one important thing: shifts after user interactions are allowed if they happen within 500ms after. They are expected and do not influence CLS.
Key takeaways
- Performance is key for user experience
The Web Vitals initiative aims to help focus on the metrics that matter most: loading (LCP), interactivity (FID), and visual stability (CLS). Performance is the foundation of any good user experience, with real business benefits.
- Measure Lab and Field
Core Web Vitals metrics can have their score affected by user interaction. Only field measurement can accurately capture the complete picture. Lab measurement is the best way to test the performance of features during development. It’s also the best way to catch performance regressions before they happen.
- Optimize your Core Web Vitals
Aim to reduce the number of assets served. Reuse through caching and service workers. Optimize the content that’s critical. Reserve the space ahead of time for visual stability.
