Is your app ready for Core Web Vitals?
February 11, 2022

So what are Core Web Vitals in the first place?
Google Core Web Vitals are new user-centric metrics set by Google that evaluate the user experience of your app. Google came up with three basic metrics quantifying user experience:
- LCP - How long does it take until the user sees the biggest portion of your content
- FID - How long does it take a page to respond to user actions
- CLS - How much layout jumps around

What happens when I am not ready?
Google Core Web Vitals are already part of SERP evaluation. This means it already impacts your position in search results. However, it is expected that the significance of these three metrics will increase over time. It is important to realize you are not doing it just to fulfill some new metrics required by Google. You are doing it for your customers, and therefore for yourself.
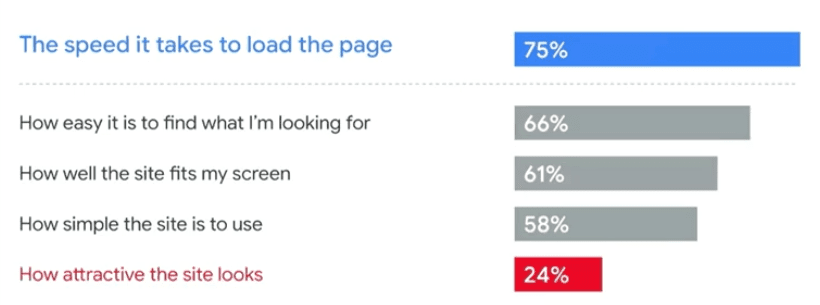
Even 0.1 point faster load time can increase your conversion rate by 5%. Speed matters the most, according to many studies.
Is my site ready?
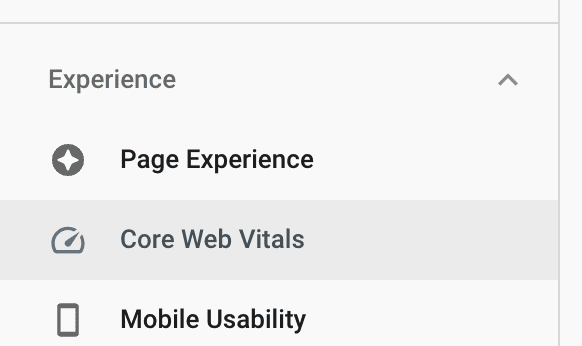
It is quite easy to check it. Google Search Console scans your site and provides you with data for each URL so that you can see how compliant you currently are. To check your site, just go to Google Search Console website, activate the search console, and check Core Web Vitals status.
Navigate to Experience -> Core Web Vitals section and click on Mobile or Desktop details

Not performing well?
Check Lighthouse
The easiest way to fix your site is by fixing the type of page that covers most of your URLs. In most cases, that page is a product detail page for e-shops. To improve its performance, run Lighthouse check on this site to see what needs to be fixed.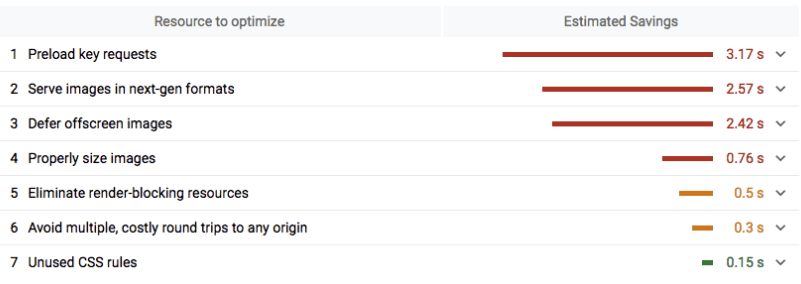
As you can see in the picture, Lighthouse gives you some useful hints about what is wrong with your page. Focus on quick wins from top to bottom.
Check GTM
You can spend tens and hundreds of hours shrinking your page’s size to a fraction of its initial size and then finally feel proud of green Core Web Vitals, but ironically there is a Google tool that can kill it all and bury your efforts and investments too. That tool is GTM.
Now let’s say that our app has a size of 500 Kb, which is pretty huge. We managed to shrink it down to 300Kb, maybe even less. And then somebody injects YouTube media player via GTM.
Check Monitoring and profiling tools
Another bottleneck can be monitoring tools - Hotjar, Sentry, and many other tools. We need those tools for monitoring, bug fixing, and other use cases. However, do we need it all the time? Would it not be enough to enable them just shortly after release? Do we really benefit from logging customer errors when there was no release in the past seven days?
Consider how useful data from browser monitoring and logging tools really are, how often, and especially on which occasions you are using that data. Maybe you do not need them at all?